Czech data - A quick first look
More to come later
References:
Summary
Please read Steve’s article to get a summary of what the data is about
There appears to be age and gender composition confounders
That need to be addressed more carefully
It does appear Moderna is less safe than Pfizer (but the calculations need to account for age and gender compositions)
Agree with Joel that there is likely significant misclassification
People who die shortly after being jabbed may not have had their officials records updated at all. (Which would make the “vaccines” look better and the unvaccinated worse, and may accentuate the HVE in the early weeks following the jab.)
The results of the bucket analysis for individuals that received a first dose is included in the link. It is a CSV file you can use to do your own analysis. There is a lot to explore. Columns include:
Month (shot was administered)
Dose number (Just 1 for now. Will run another analysis that will include 2 shots soon)
Week (since last shot)
Age (Everyone is allocated a birth date randomly since we only have the birth year. The randomness should average itself out. This allows us to dynamically calculate the age for each individual as we progress through the date range)
Alive (person days)
Dead
Gender
Brand (vax brand)
Legends
F: Female
M: Male
CO01: Pfizer
CO02: Moderna
CO03: AstraZeneca
CO04: Janssen
Plots
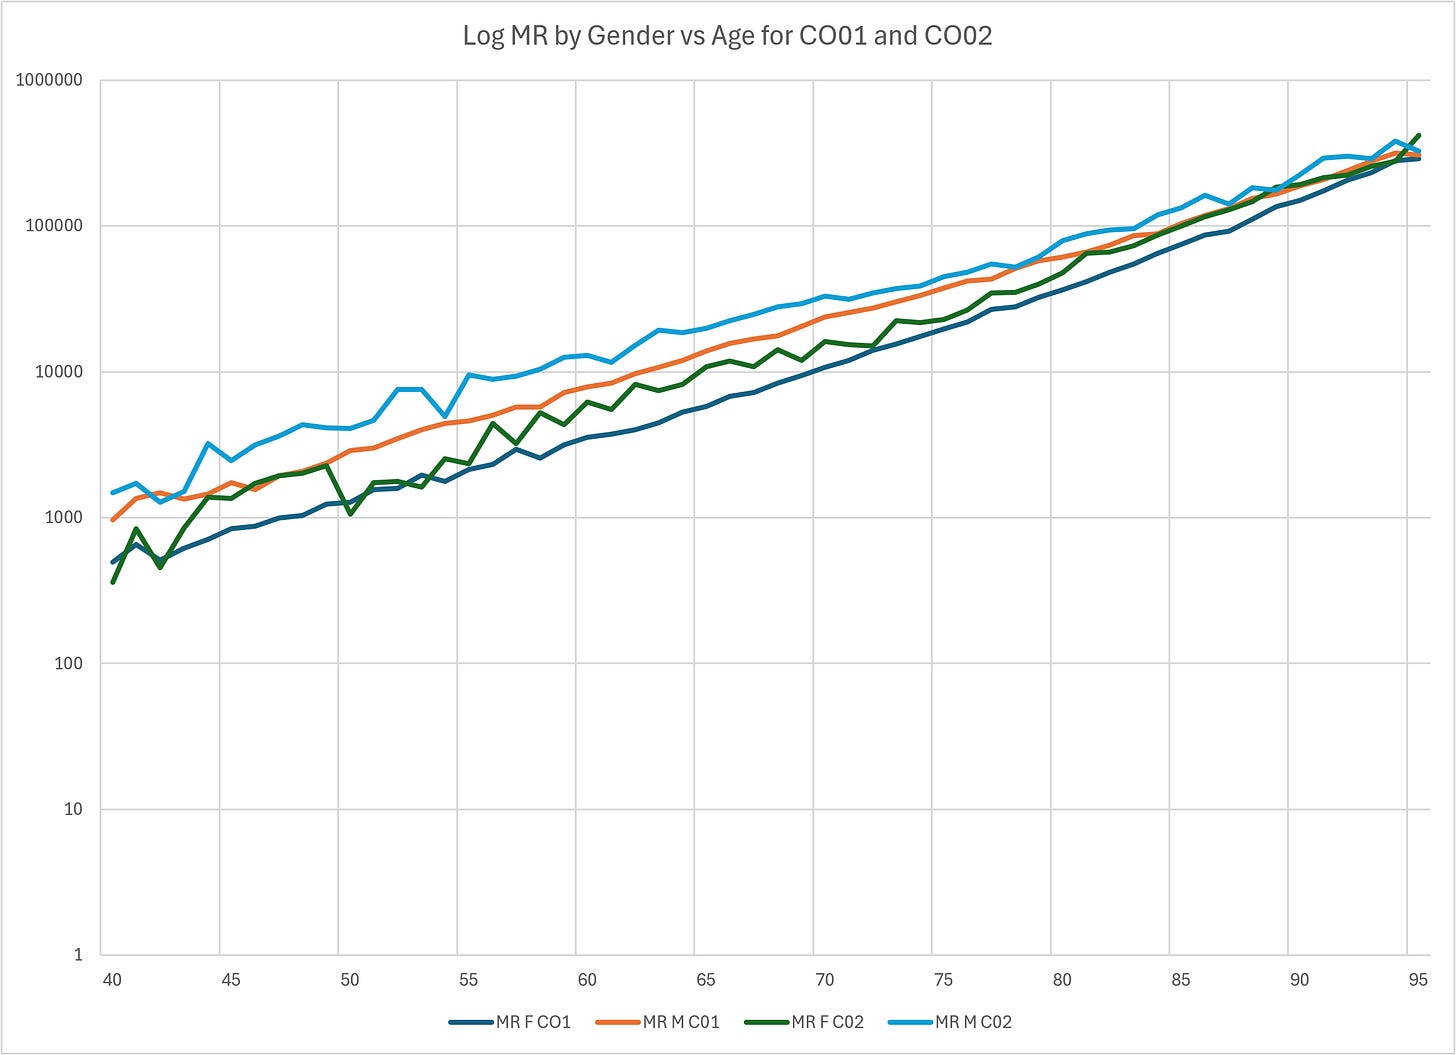
(Elevated levels of MR between 44 and 50 for Moderna Females (green line CO02) is concerning)
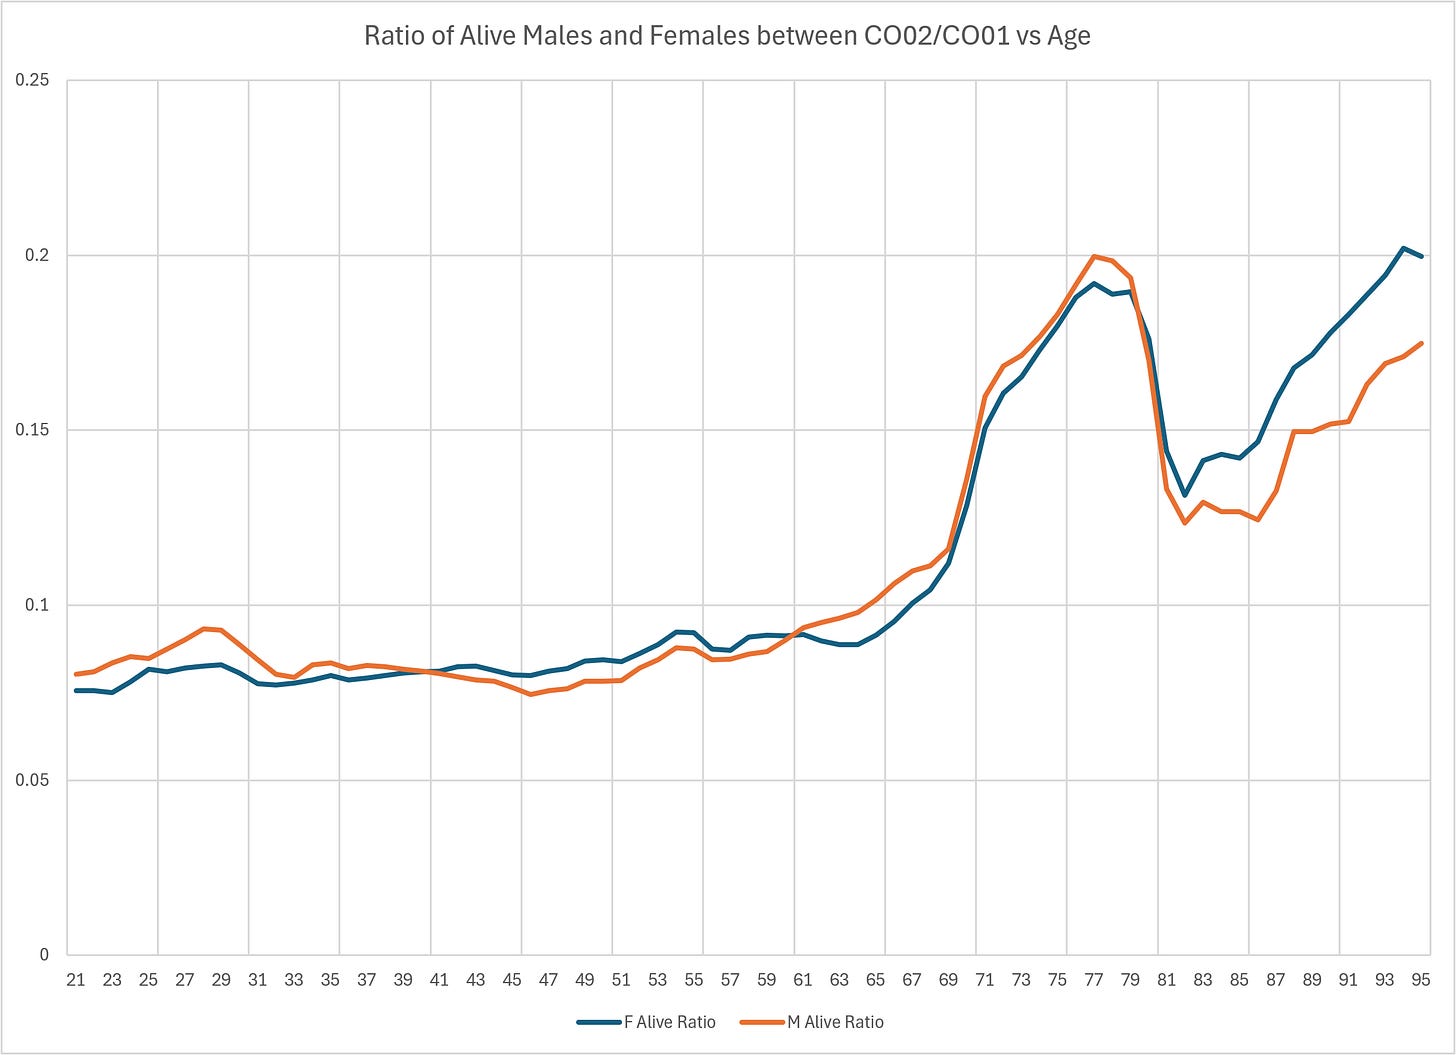
Age ratio between Moderna/Pfizer (CO02/CO01) more than doubles between 70 and 80, and seems to account for the dip in Steve’s plots for the same age range.
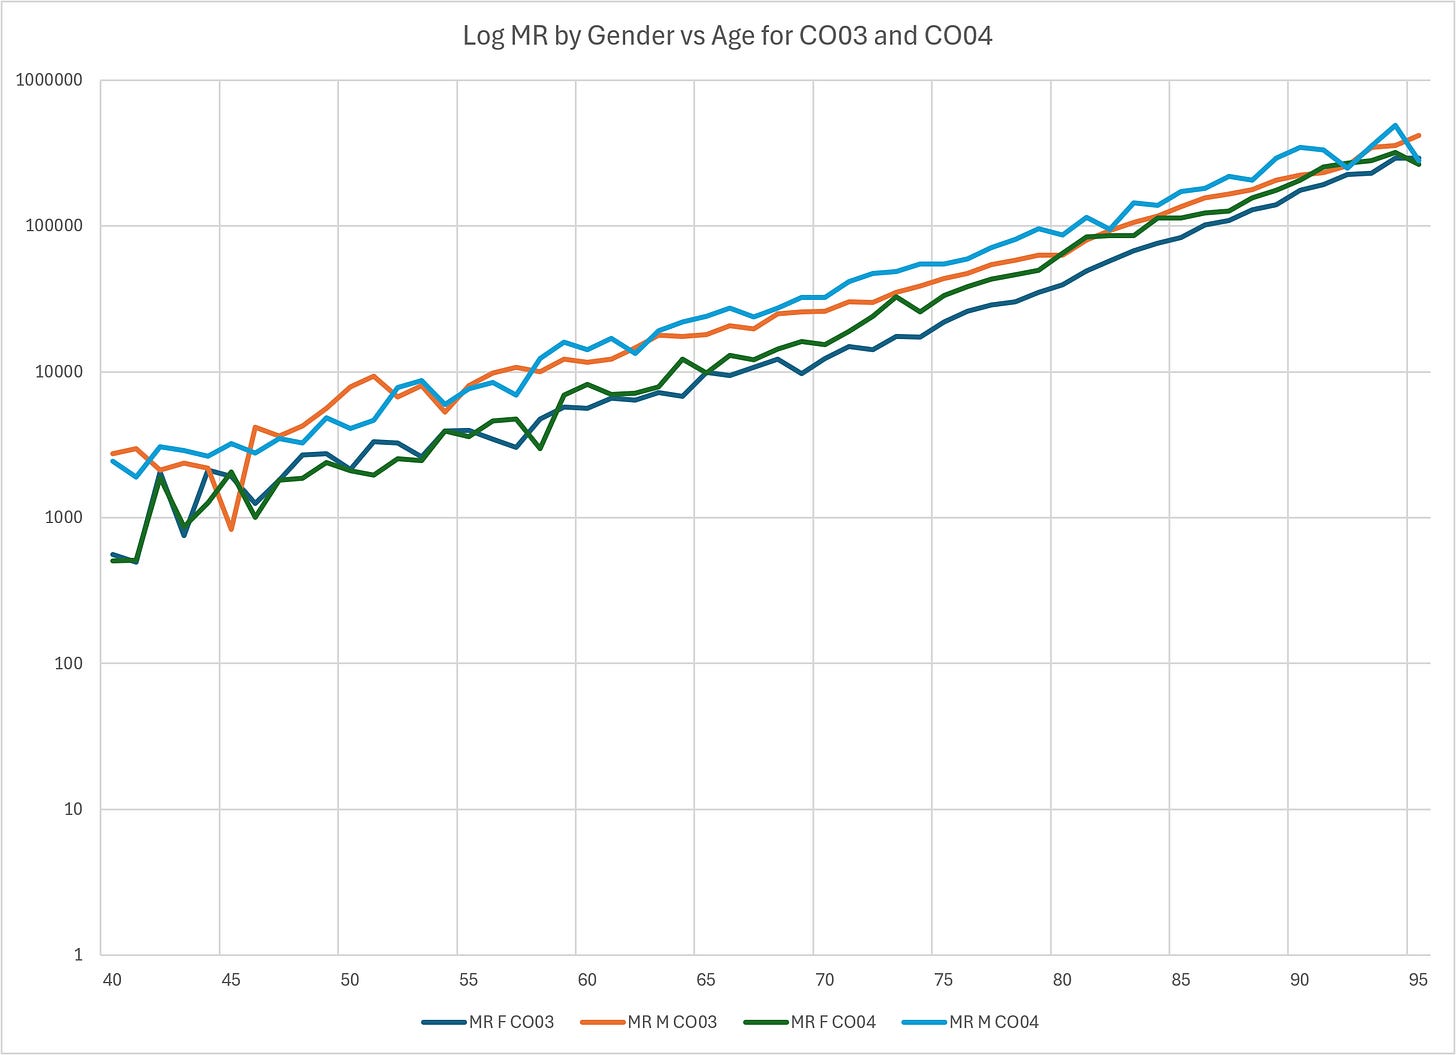
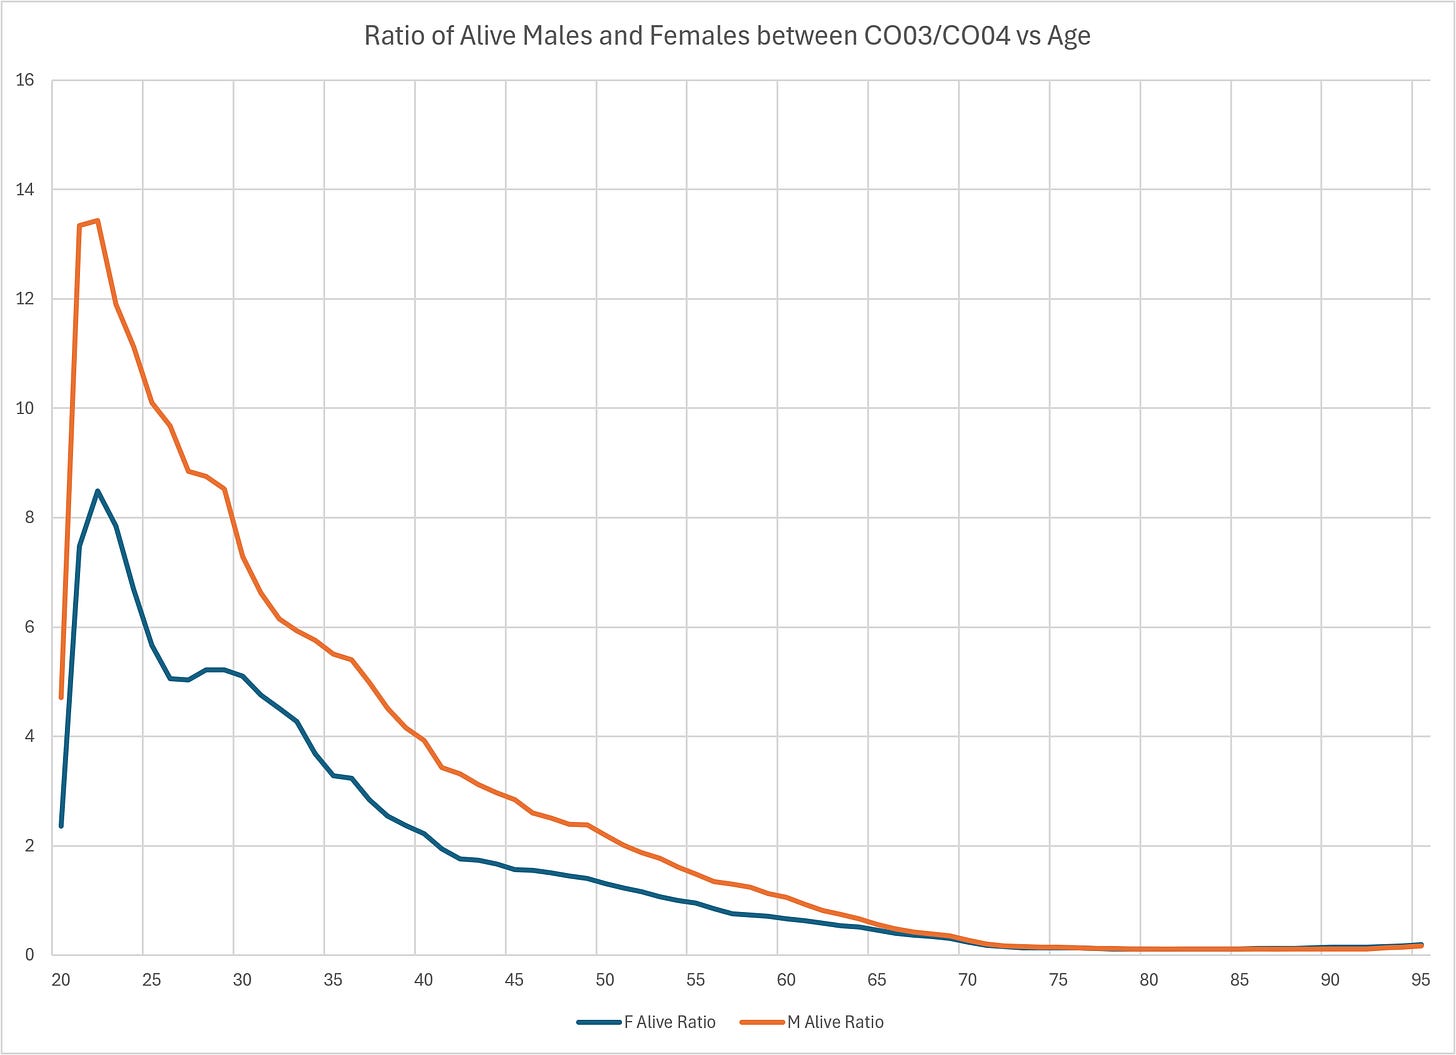
NOTE: The ratio plots include a wider age range, starting at 20, whereas the MR plots start at 40.
(Massive difference in ratios for different ages)
That is all for now. Will post more over the coming days.


